Click on Discovery Solutions on the Unified Portal, then select your industry (Mortgage)
2
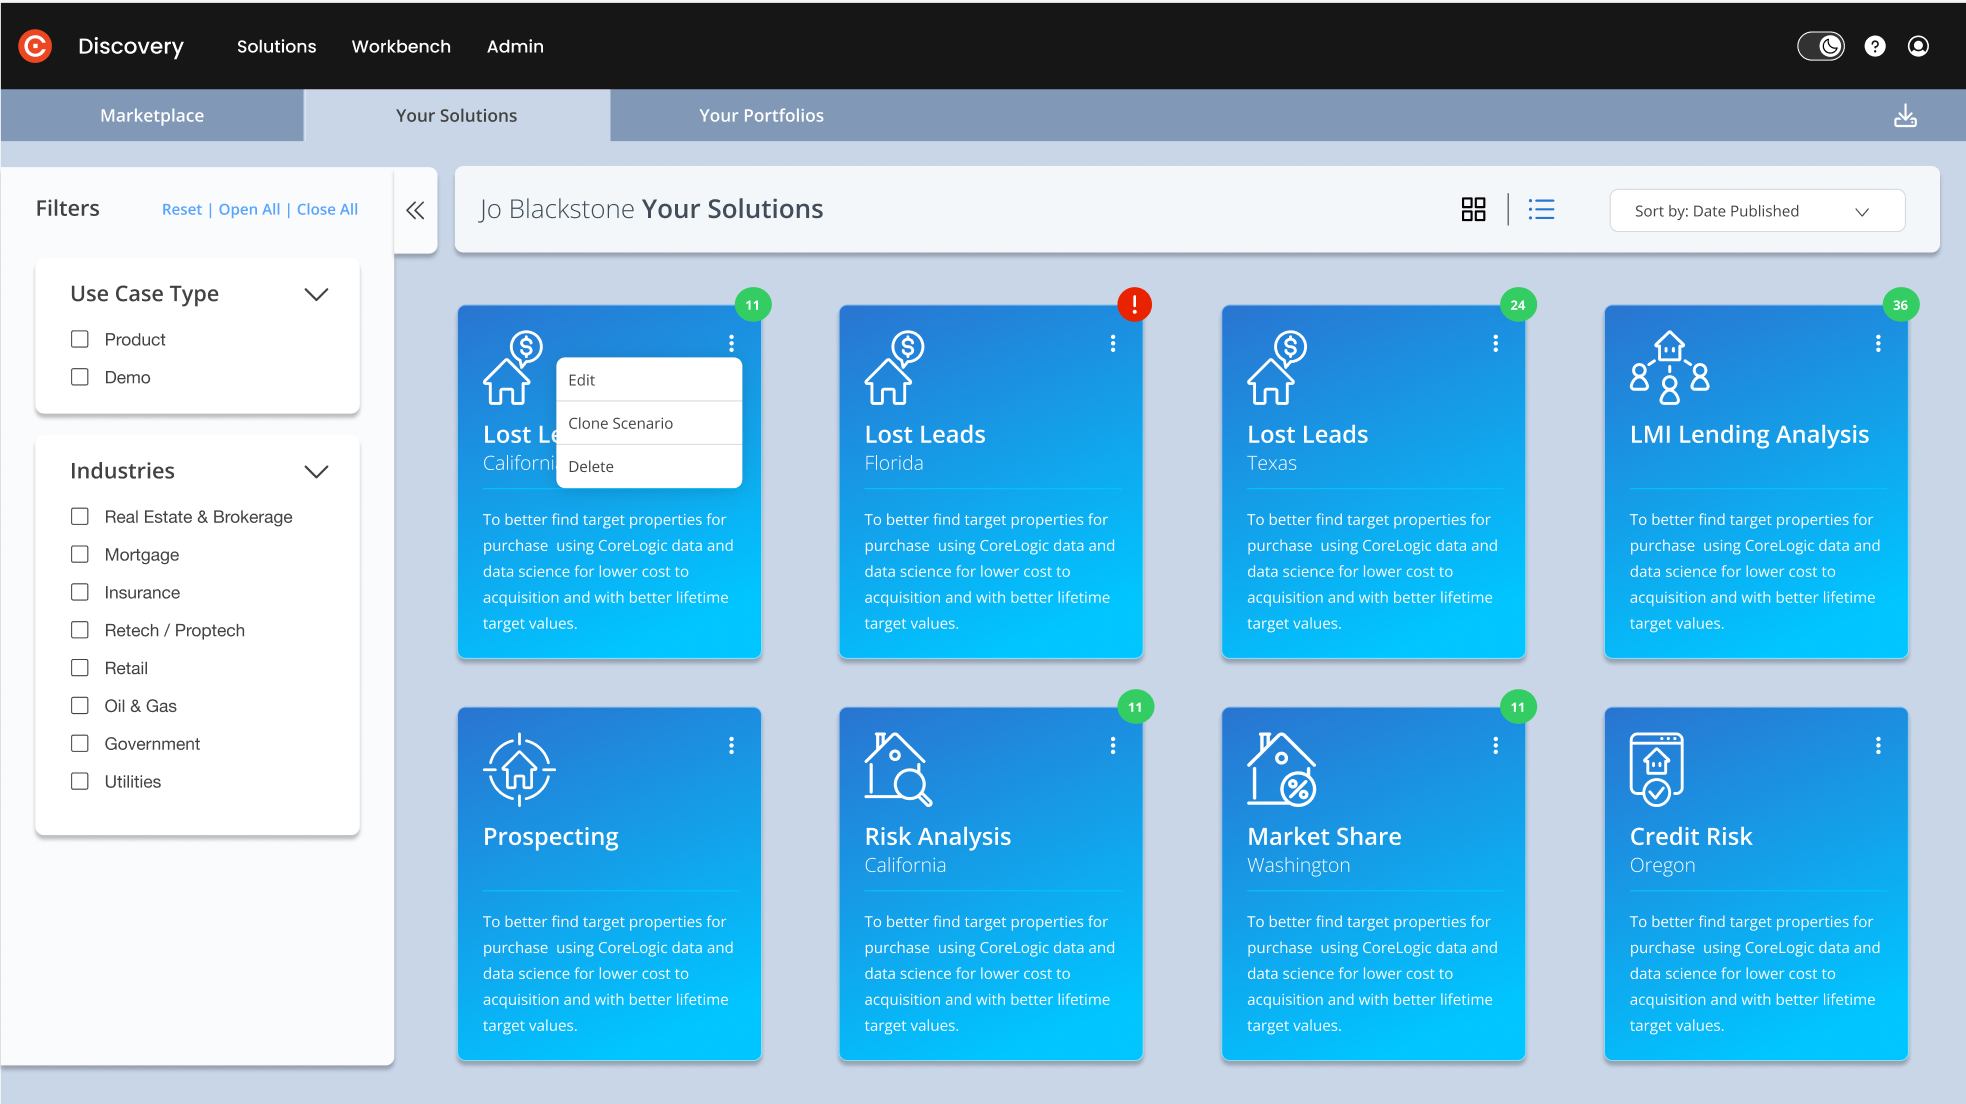
Select the Lost Leads Use Case
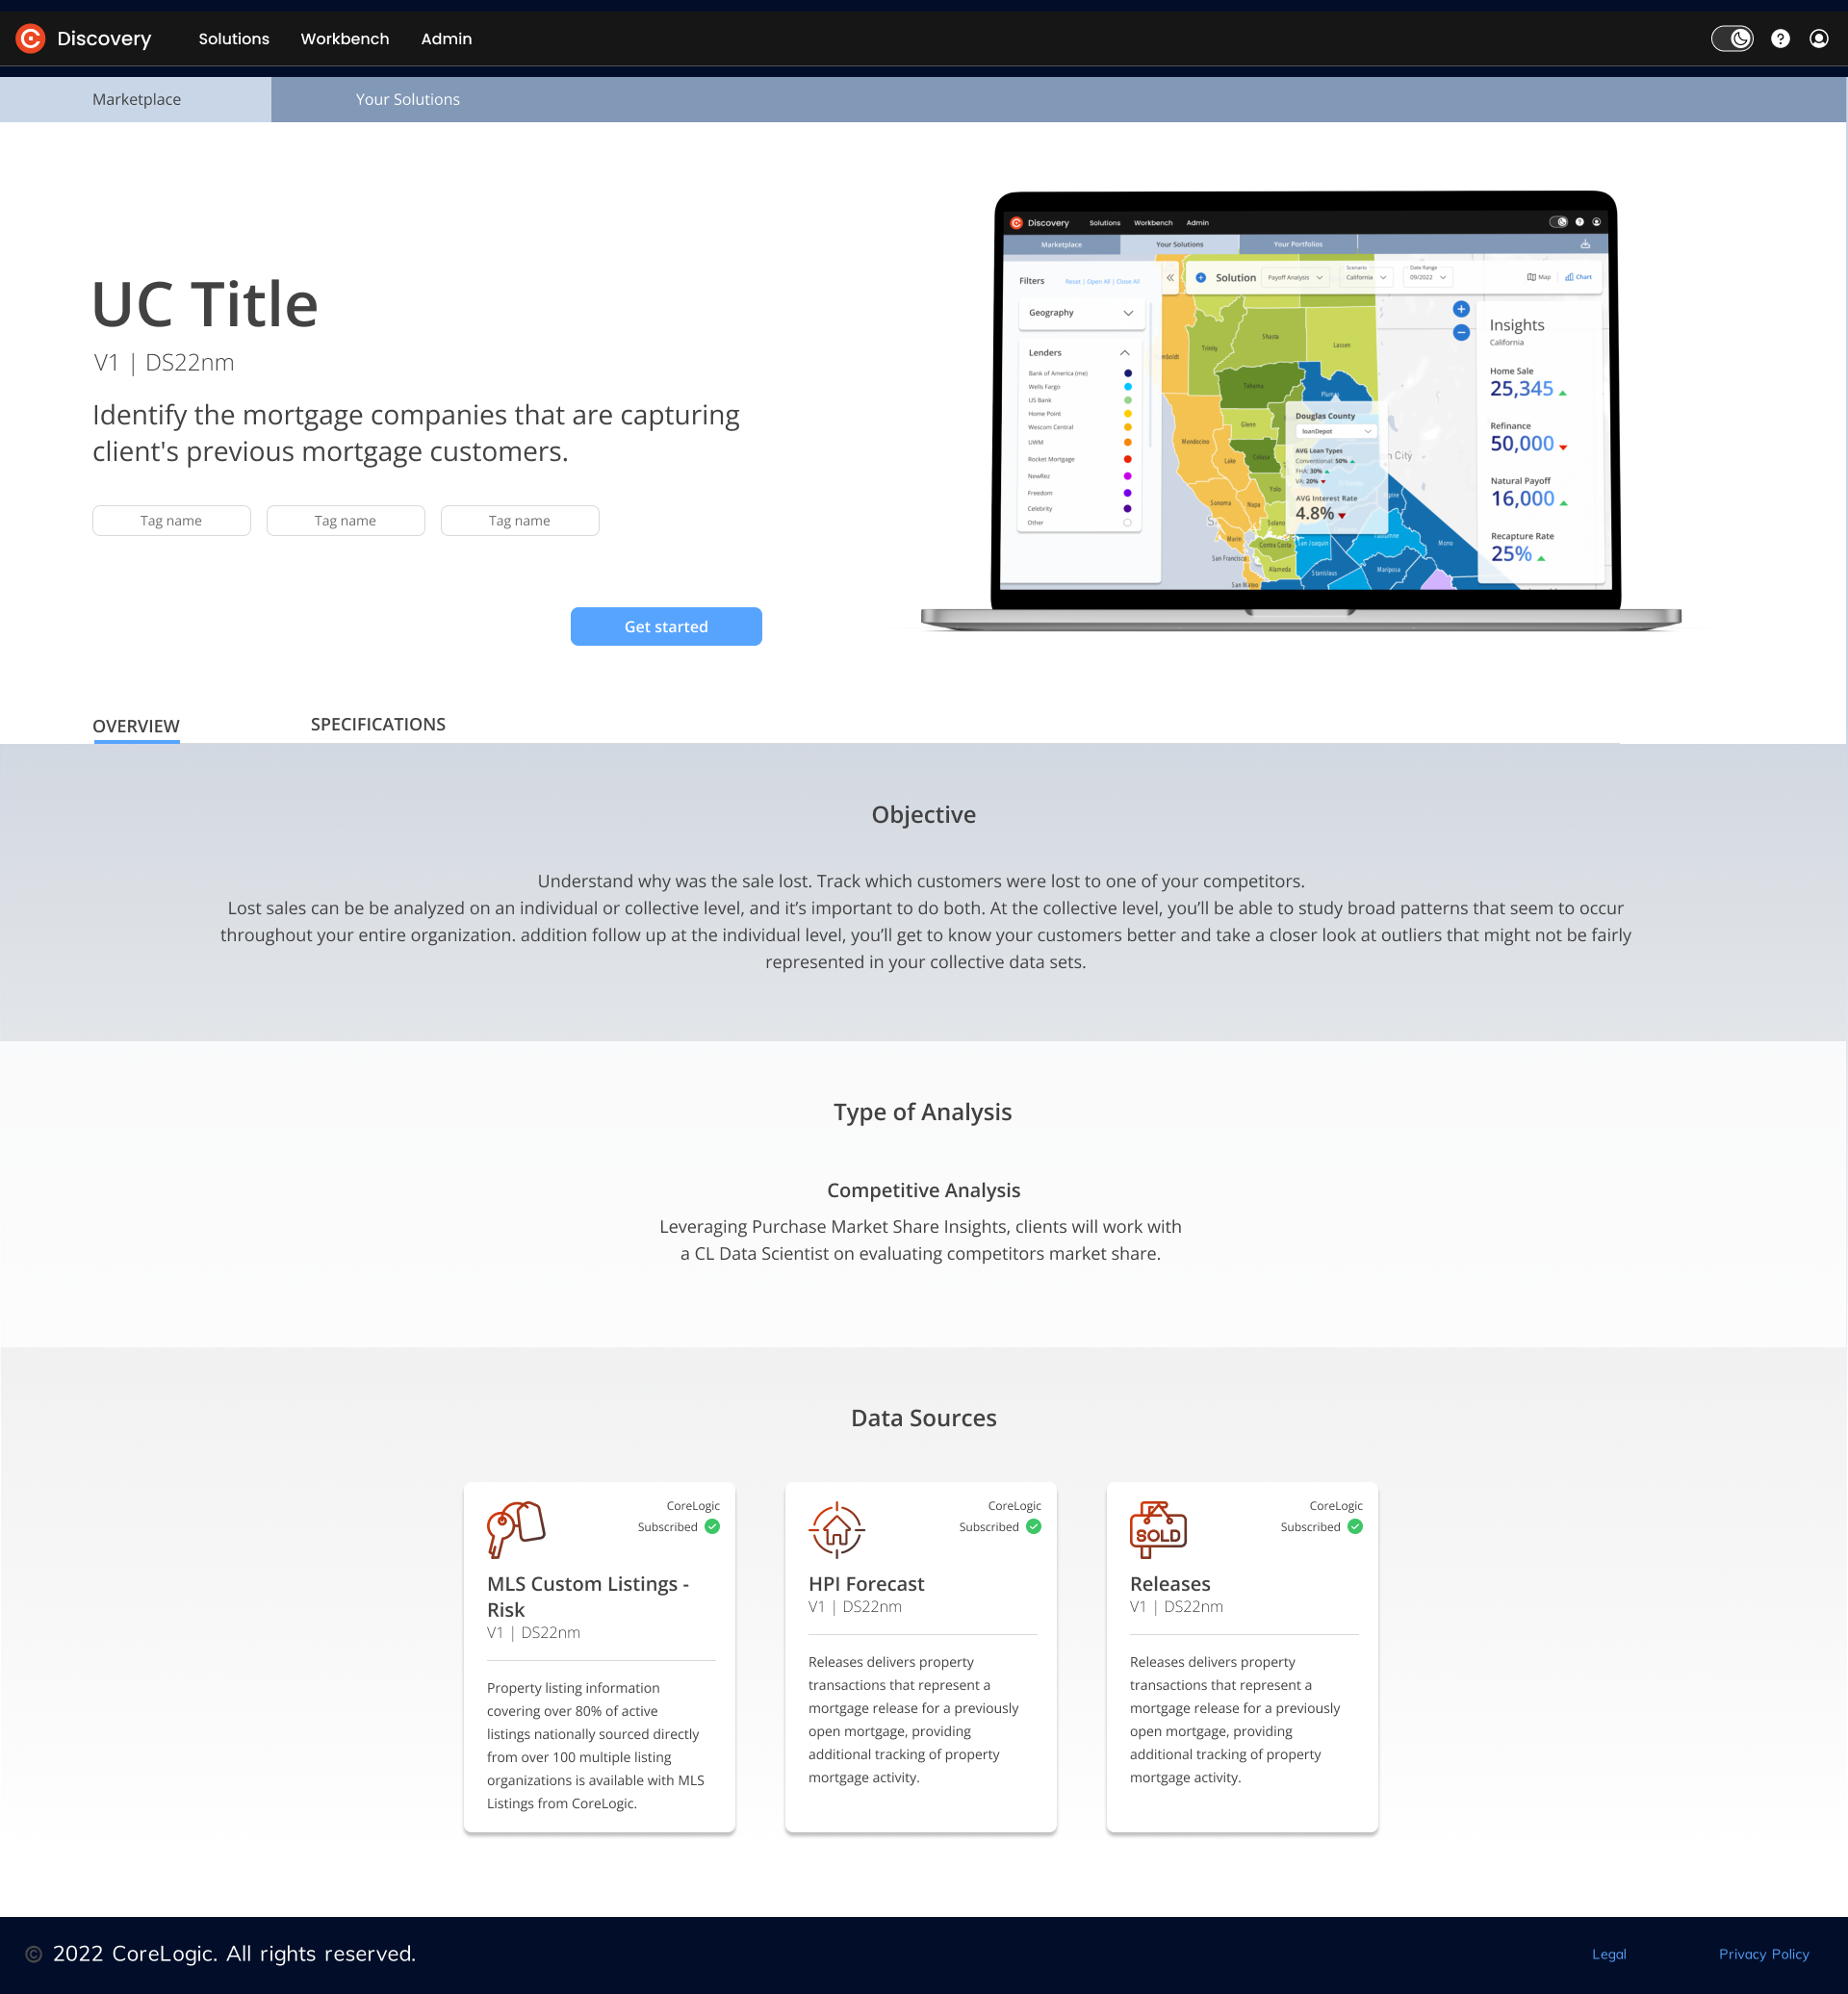
Choose Lost Leads from the Marketplace. Click “Learn More” on the Solution tile.
On the next page, click the blue “Get Started” button.
3
Select or Create aScenario
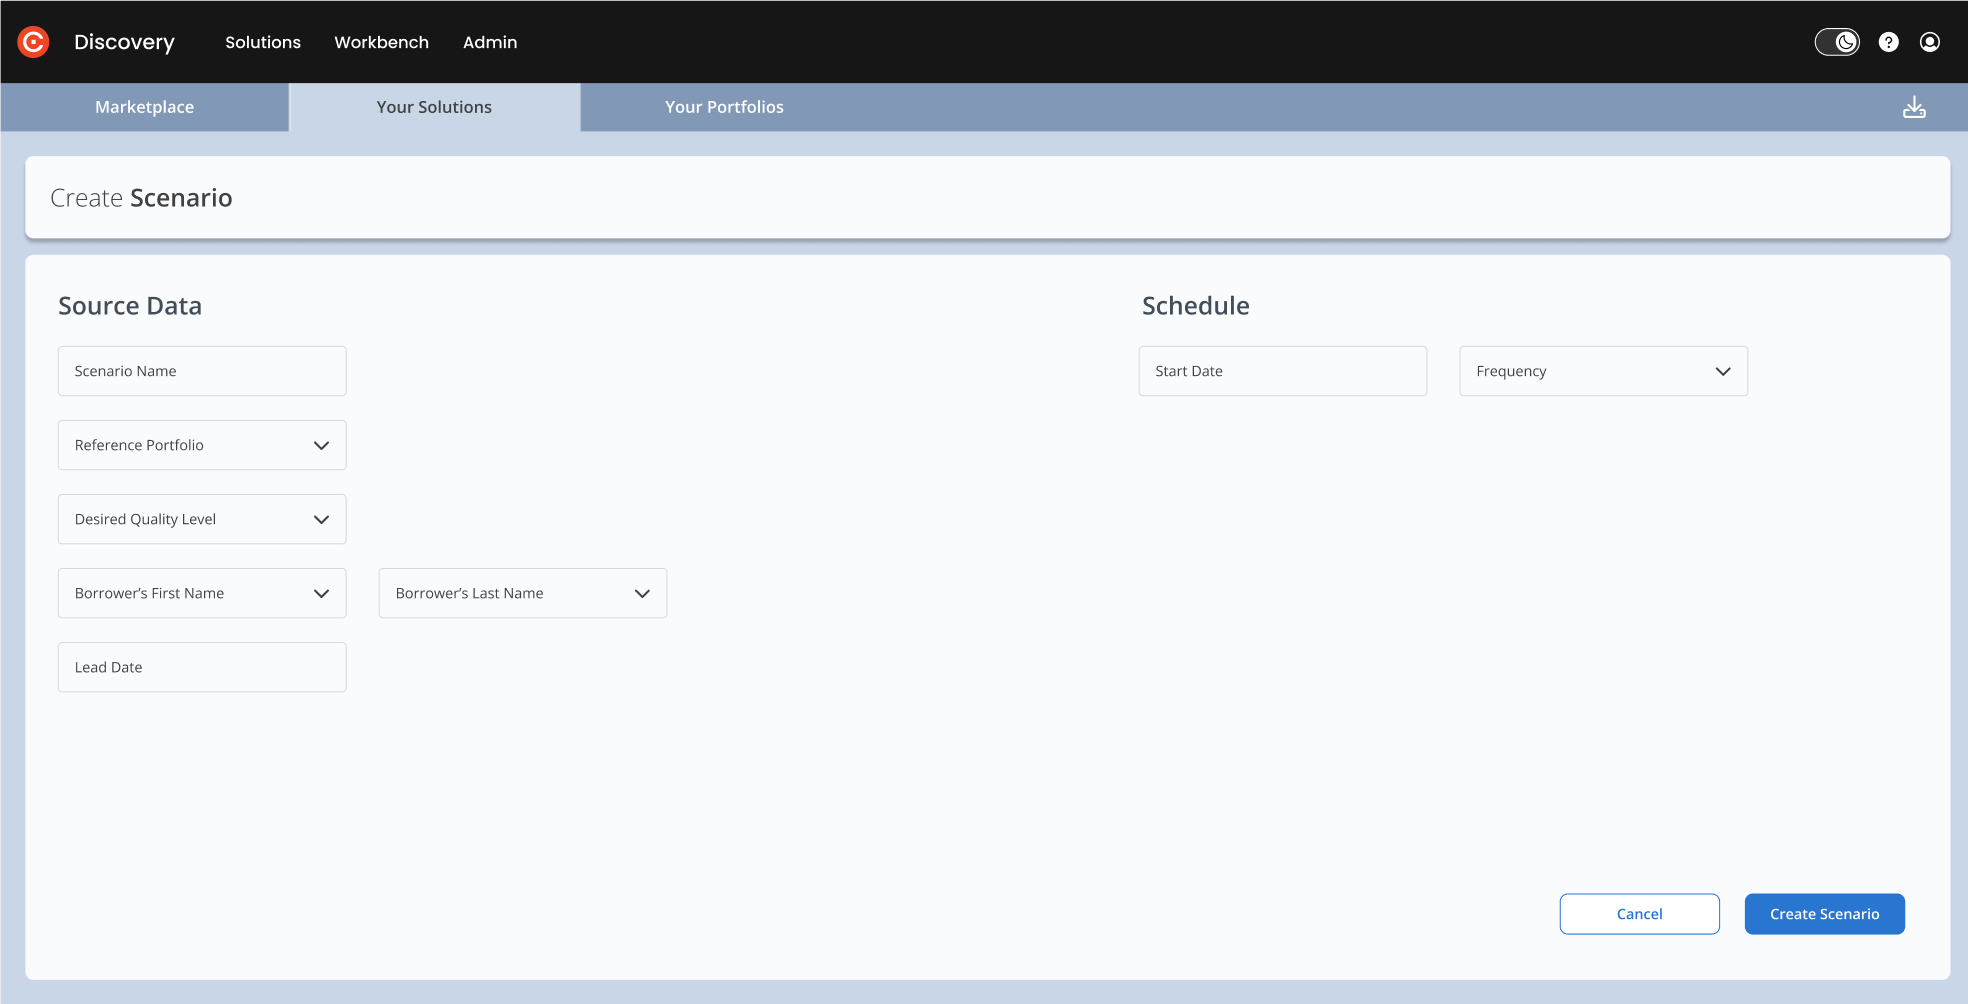
Choose a previous scenario to use for your use case or create a new one. Complete all the fields and select “Create Scenario”.
Scenario Name: enter a name of your choosing.
Reference Portfolio: select which portfolio, or list of loans, you want to use.
Desired Quality Level: choose the minimum level of quality for a loan CLIP quality index. This will help determine the quality of your data. The range is from 1-10, with 10 being an exact match.
Enter the Borrower’s First and Last Name.
Enter the Lead Date: this is the date the lead was first captured.
Schedule: From the menu, select the date you want to begin.
Frequency: How often you want to run your scenario. Choose daily, weekly or monthly.
Click the Create Scenario button when you have completed each field.
4
Select Geography
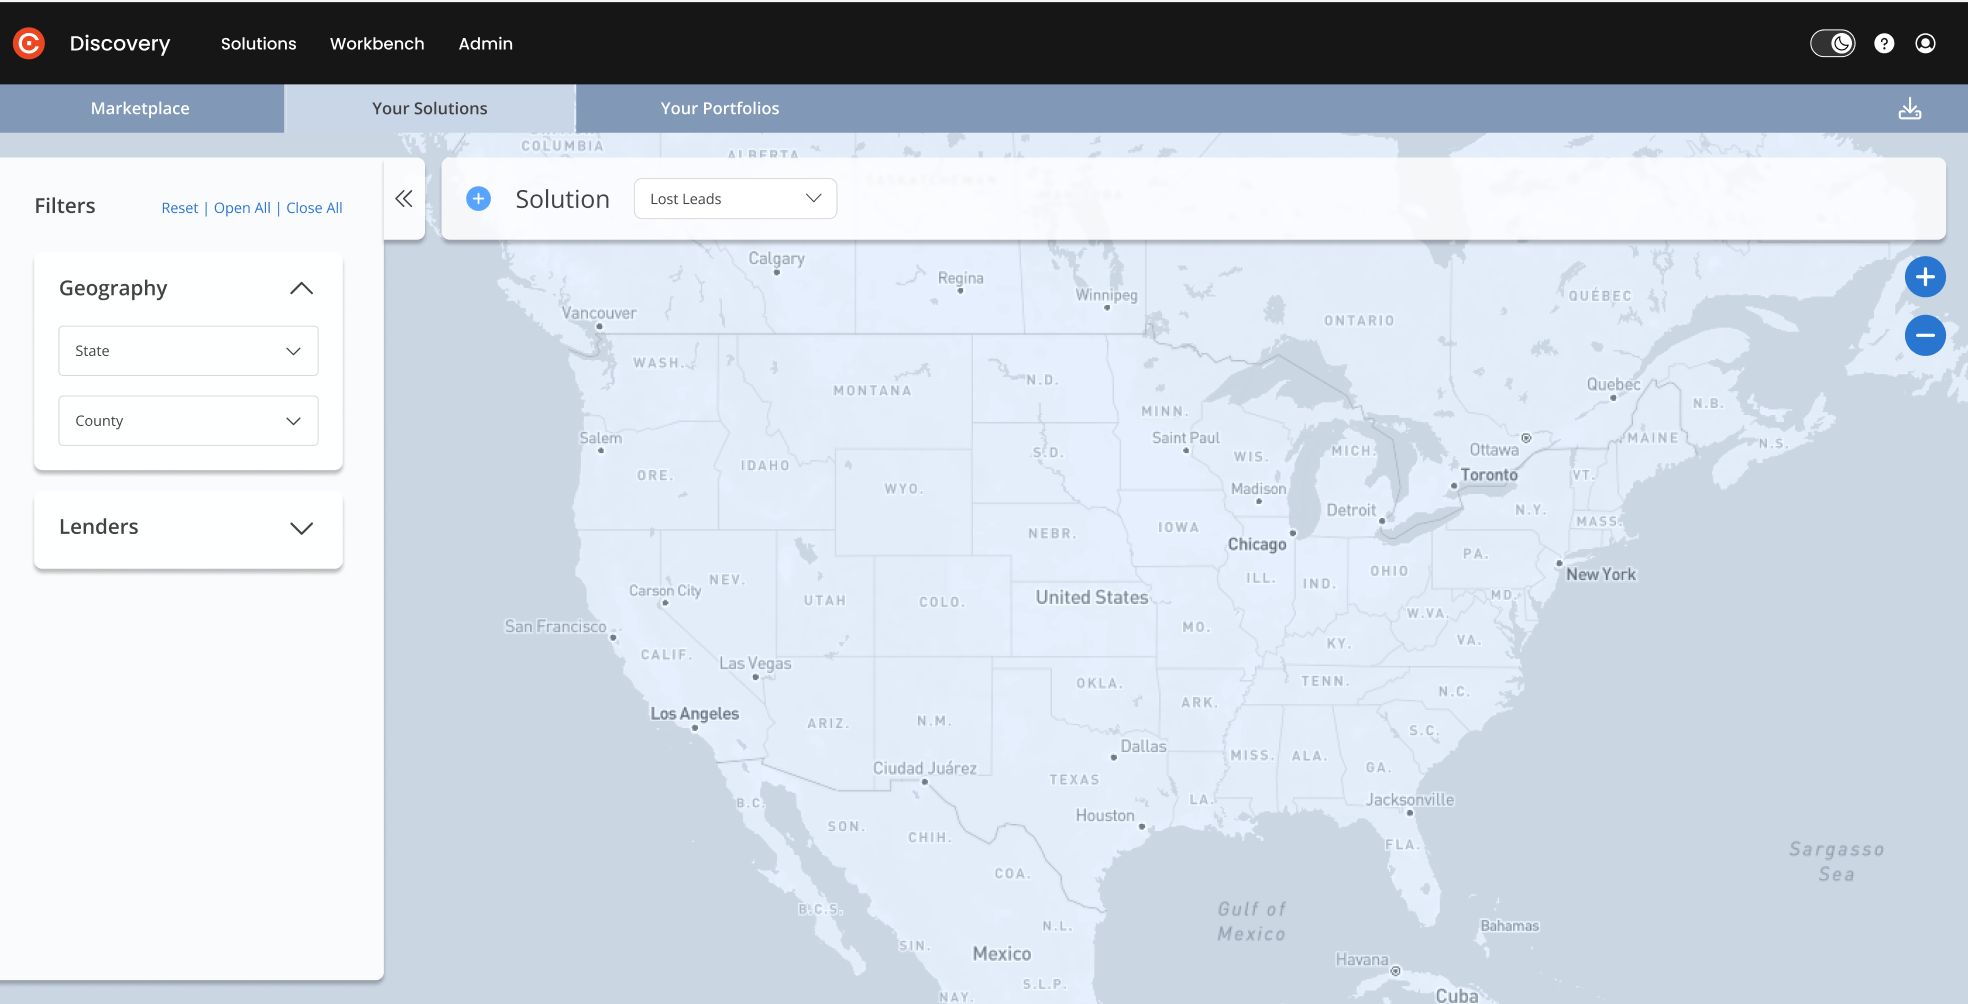
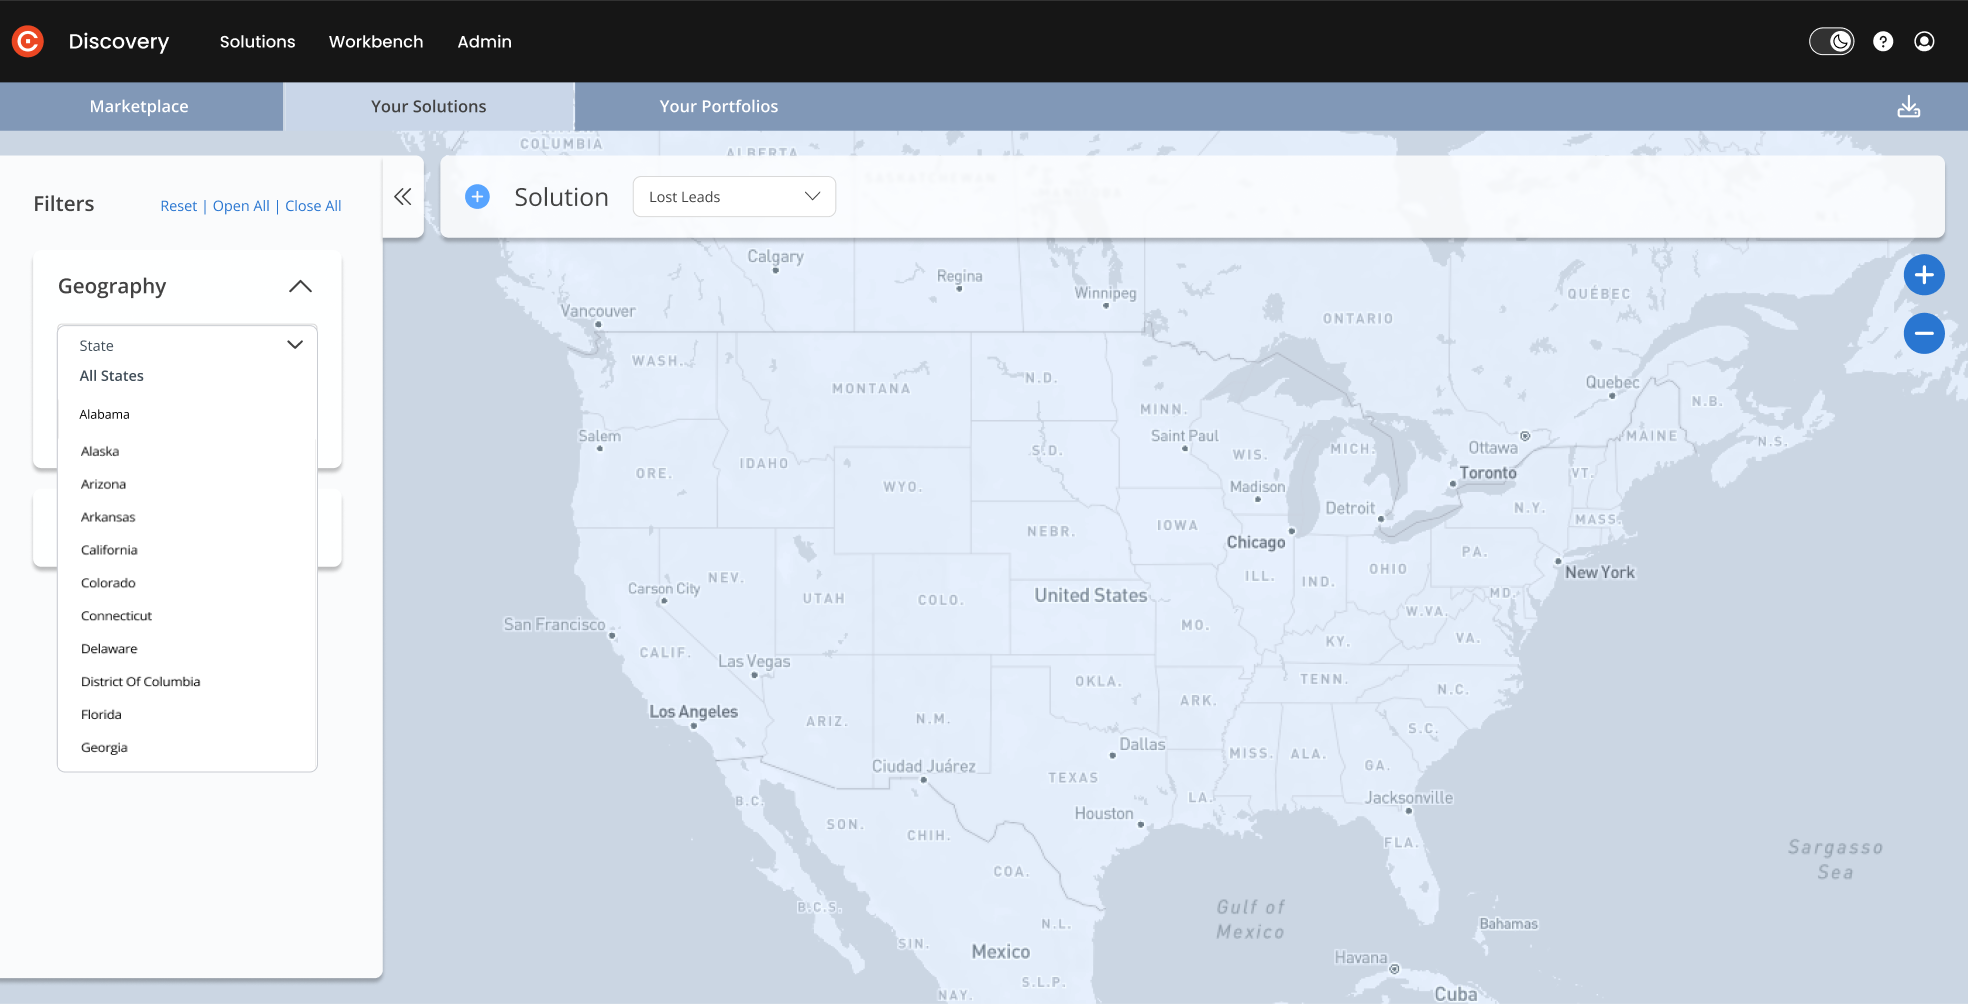
A map of the U.S. will appear.
Notice the Geography and Lenders drop-down menus on the Filters column on the left.
Select a state to view top lenders by county in that state.
5
Select a State and Zoom In
Once you select a state, more filters will appear.
You can select a county to narrow your search.
You can zoom in using your mouse or the blue + or - buttons on the upper right.
6
Filters
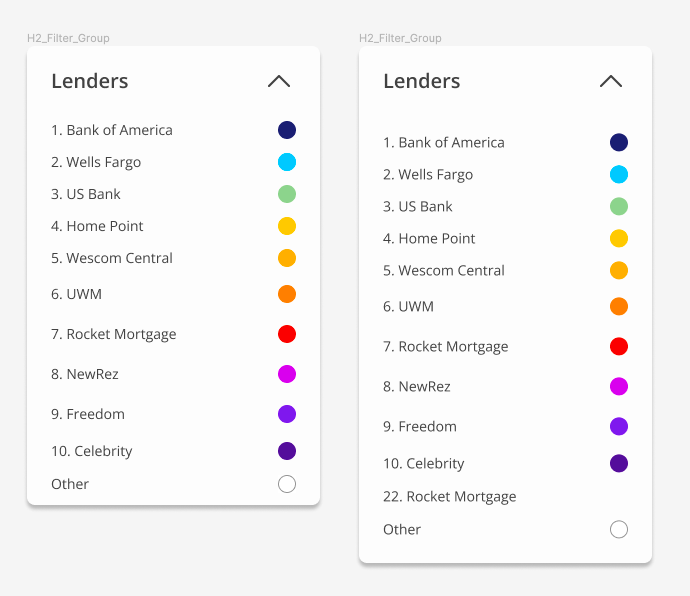
The top 10 Lenders will be visible on the map, using the color code seen here.
If your organization is not in the top 10 Lenders list, you will be shown below the 10th lender without a color selection and your ranking will be shown (22) before your name.
7
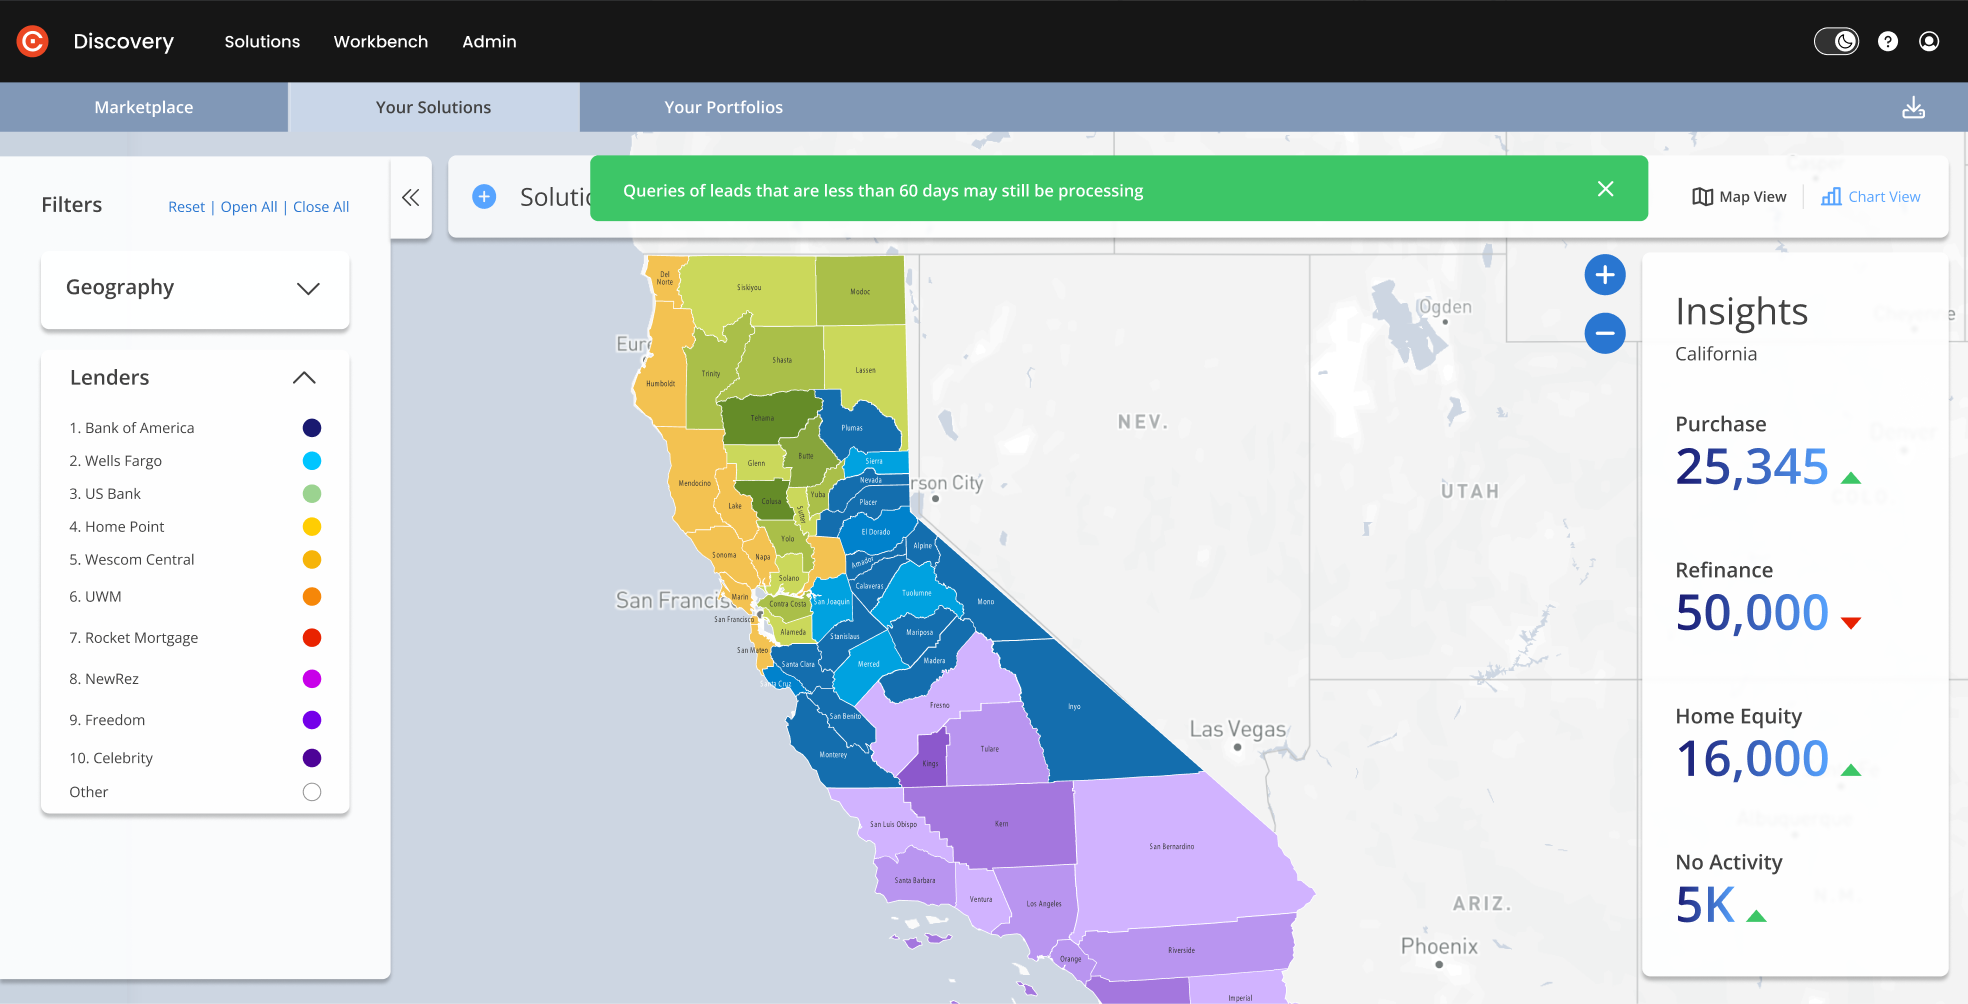
Notification
You may see a green <60 Days Notification or a Progress indicator notice which lets you know things are processing.
8
Results and Insights:
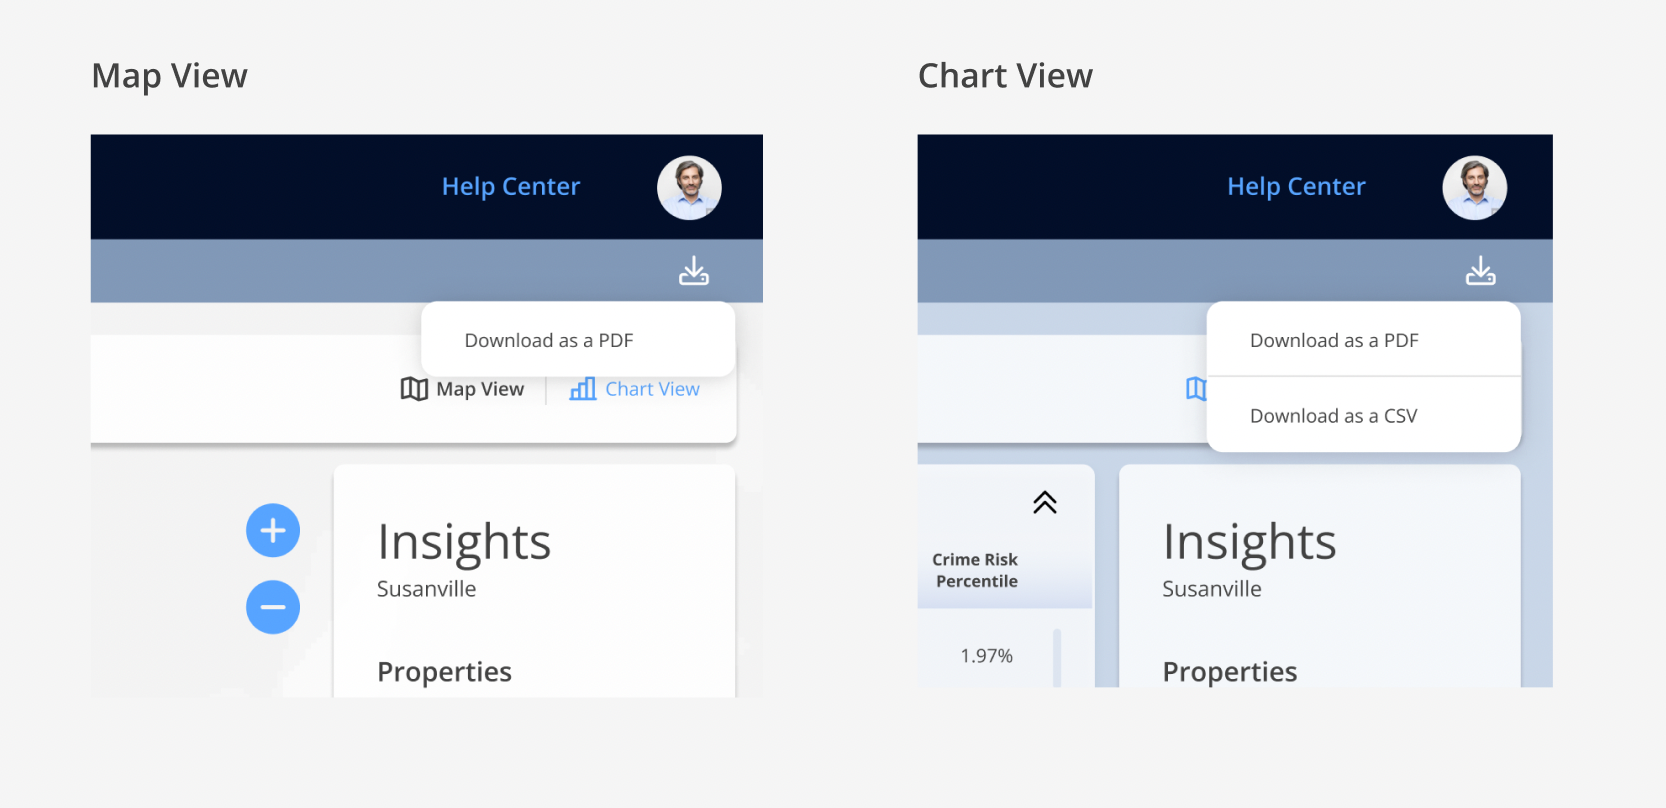
Map View
On the top right of your screen, you can switch between the interactive Map View and the Chart View.
The Map View allows you to zoom in and out and hover to see tooltip stats.
You’ll see color coding for top lenders in each county with white representing other lenders.
On hovering, the top lender in that area will be the default, with options to view all lenders.
If your company is not in the top 10 Lenders list, you will appear below the 10th lender without a color selection; your ranking will be shown along with your name.
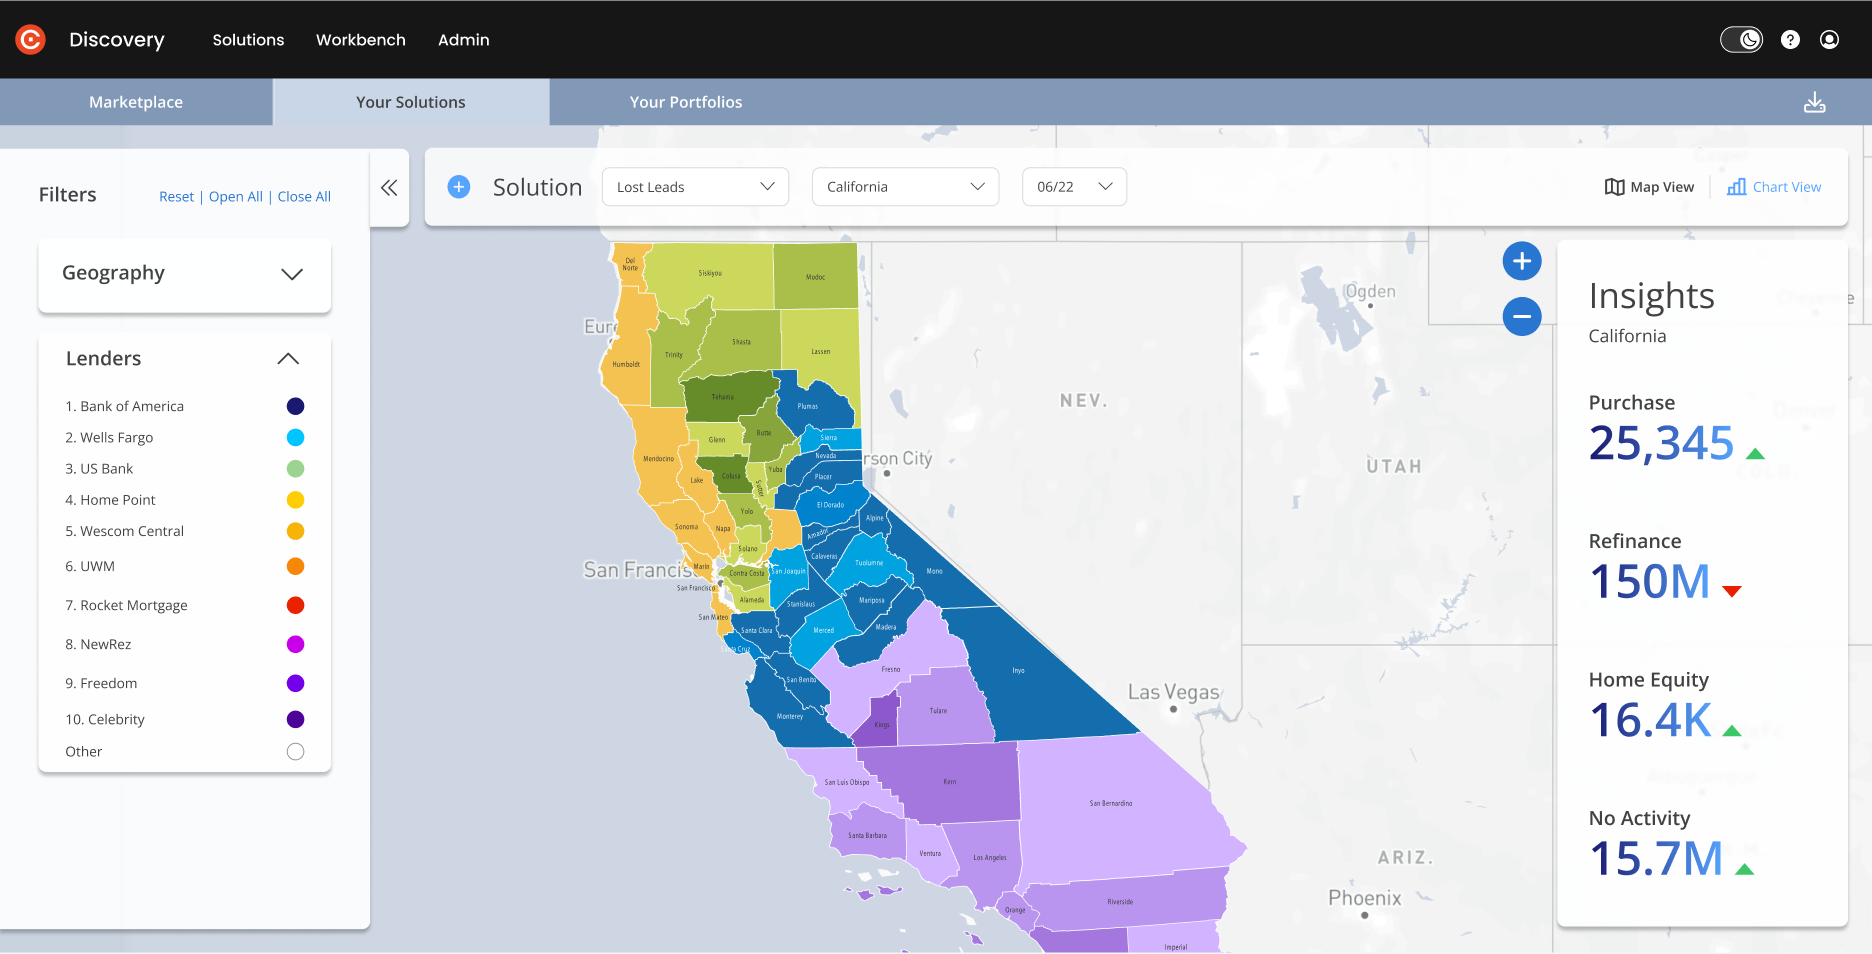
On the right, you will discover Insights into:
Lost Purchase: Lead subsequently sold their property and received a loan within 6 months of the lost lead date.
Refinance: Lead subsequently got a refinance loan on their existing property within 6 months of the lost lead date.
Home Equity: Lead subsequently received a home equity loan within 6 months of the lost lead date.
No Activity: Lead did not take a loan out within 6 months of the lost lead date.
9
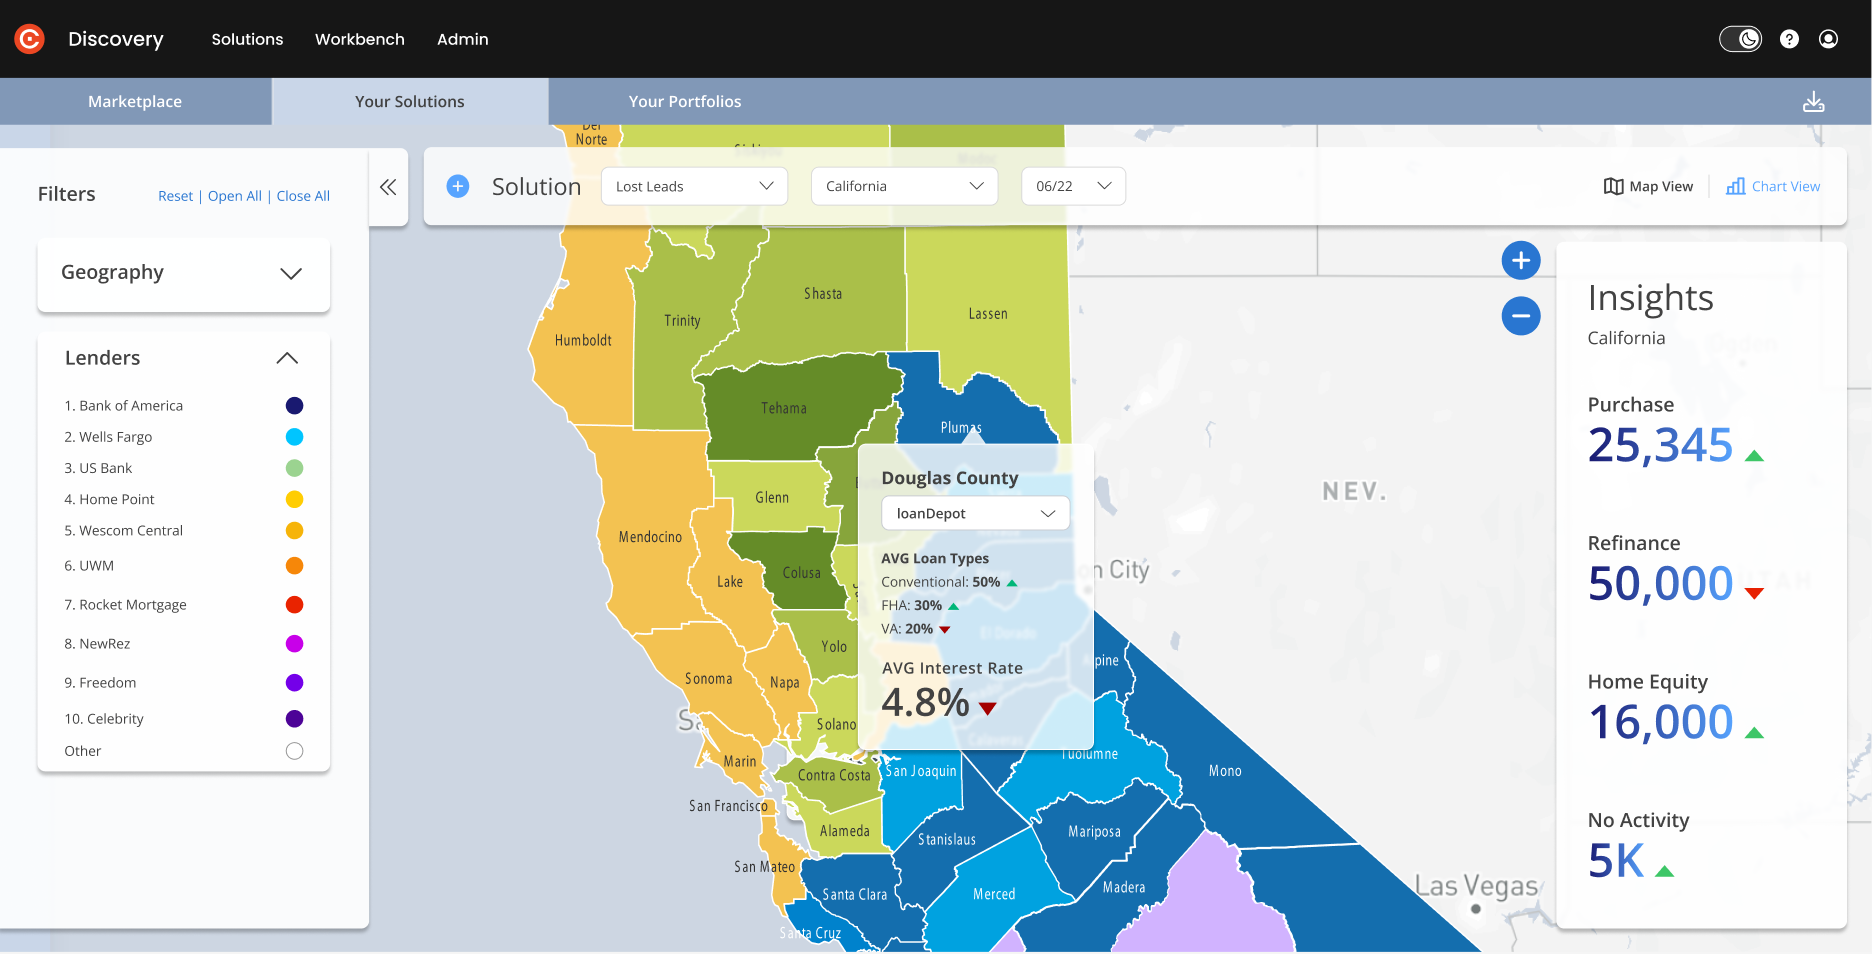
County View
The County View shows the top 10 lenders in the county.
Click on any county to see average transaction types and interest rates via the tooltip menu. You can compare these with the statewide insights on the right panel.
Default statistics represent the top lender, but you can select another lender via the dropdown menu for their stats.
10
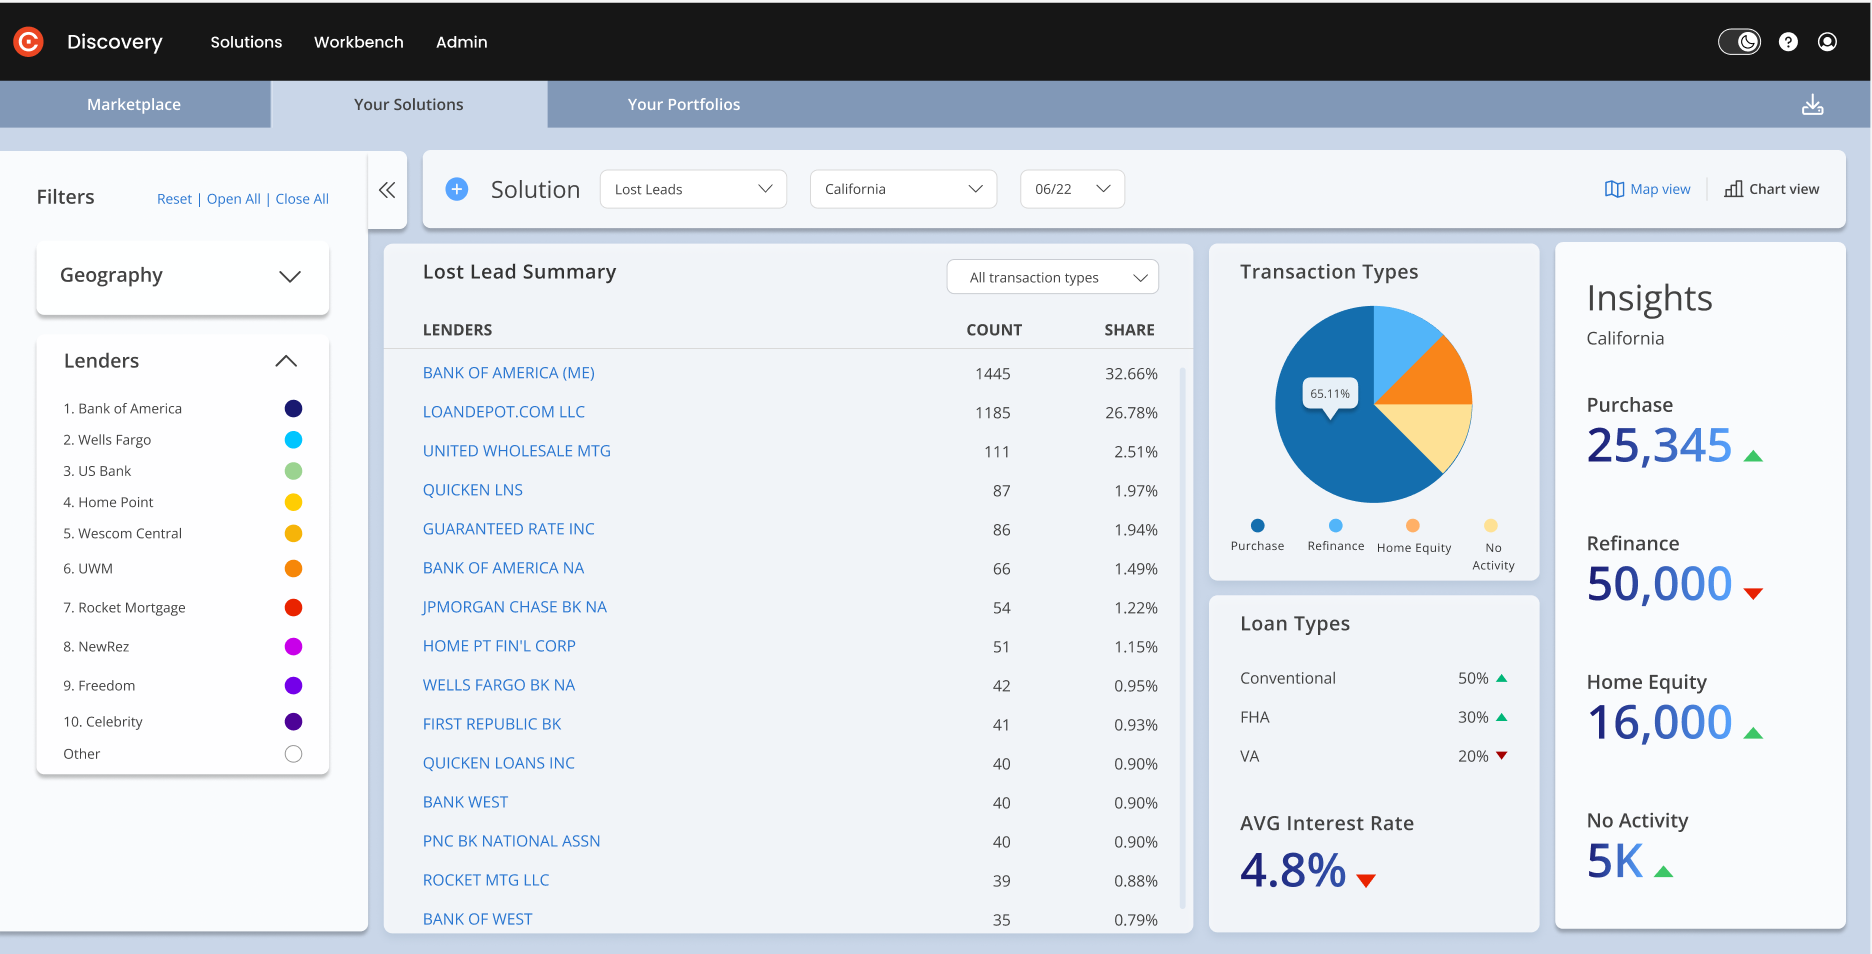
Chart View, All Lenders
Switch from Map View to Chart View (on the upper right of the screen) to see a more robust list of lenders who have taken your share of lost leads.
You can view by “all transaction types” (default) or by Purchase, Refinance or Home Equity loans.
Default numbers represent All Lenders.
11
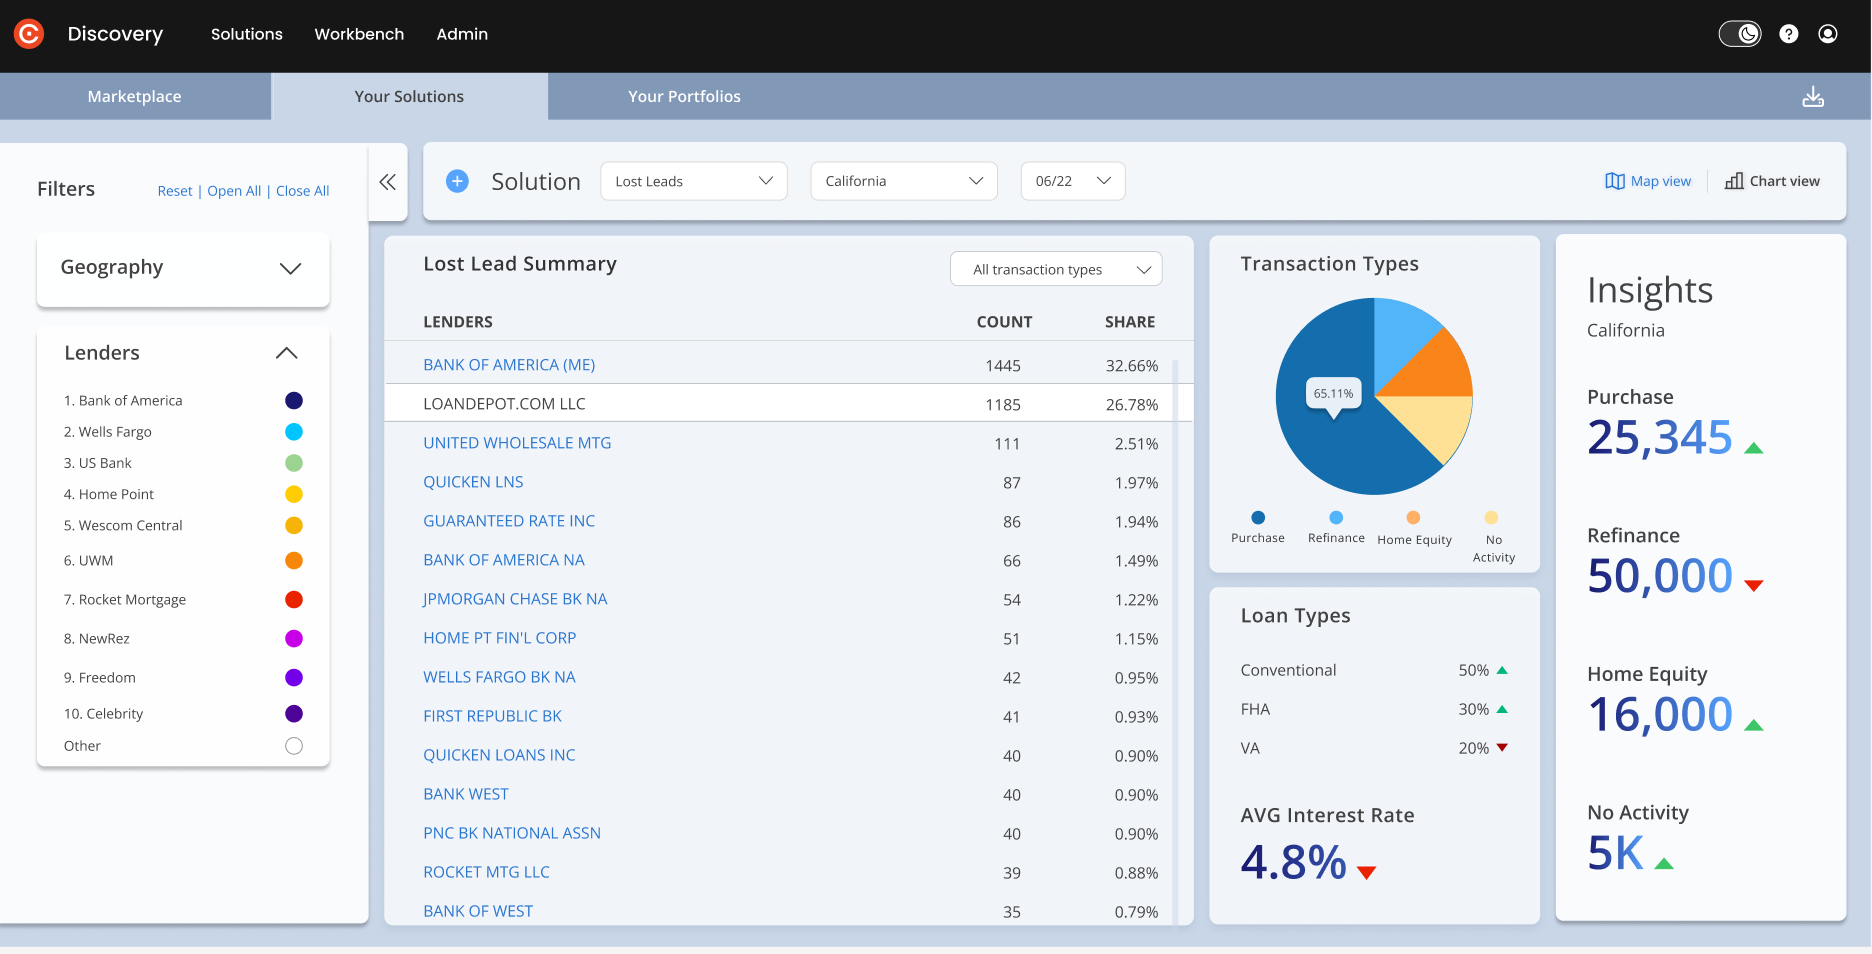
Chart View, Selected Lender
You can also choose to view one lender at a time, by selecting the lender from the dropdown menu.
Transaction type and loan type stats will represent just that one lender.
If you select that same lender again the view will return to All Lenders.
12
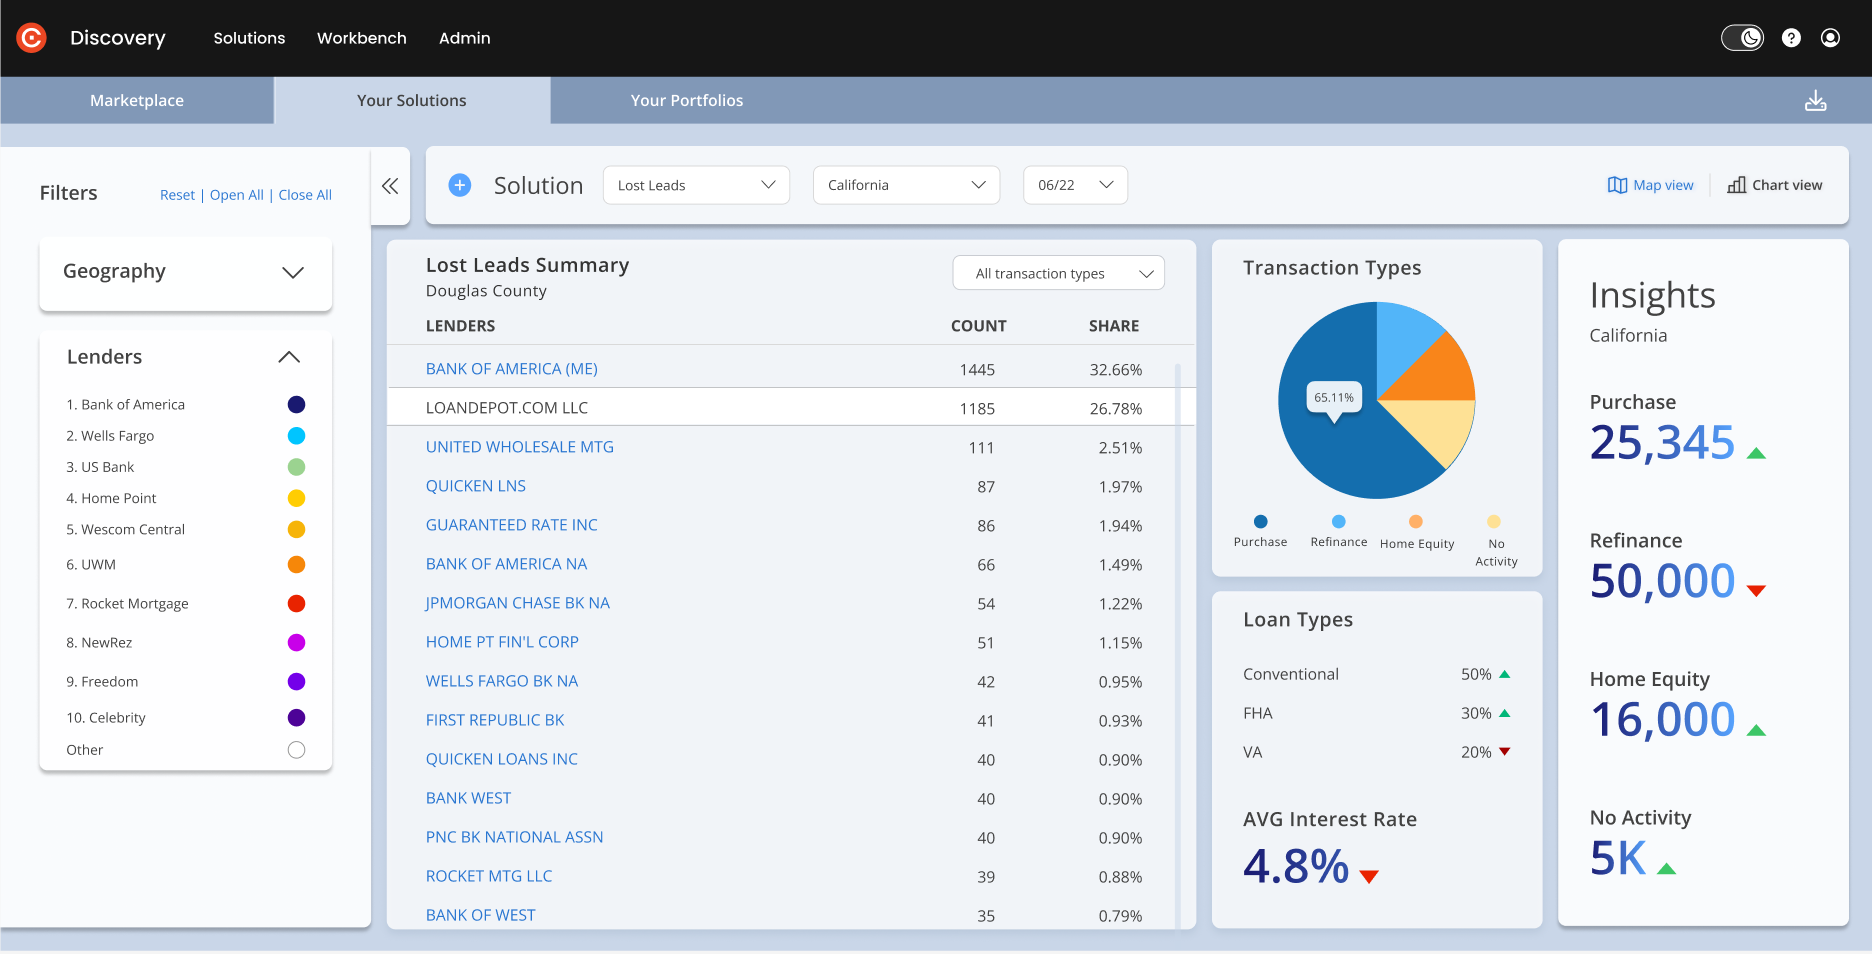
Chart View, County View
Selecting the county in Chart View will provide the top lenders in the county.
You can be sure you’ve selected the correct county name as it appears as a subhead under the title, “Lost Lead Summary”.
13
Data Export
You can download your insights via CSV or PDF from the export icon on the very top right of the screen.
The PDF export will display the data currently shown on your screen.
The CSV file will include data hidden from view (for example, within a table that scrolls, etc.)
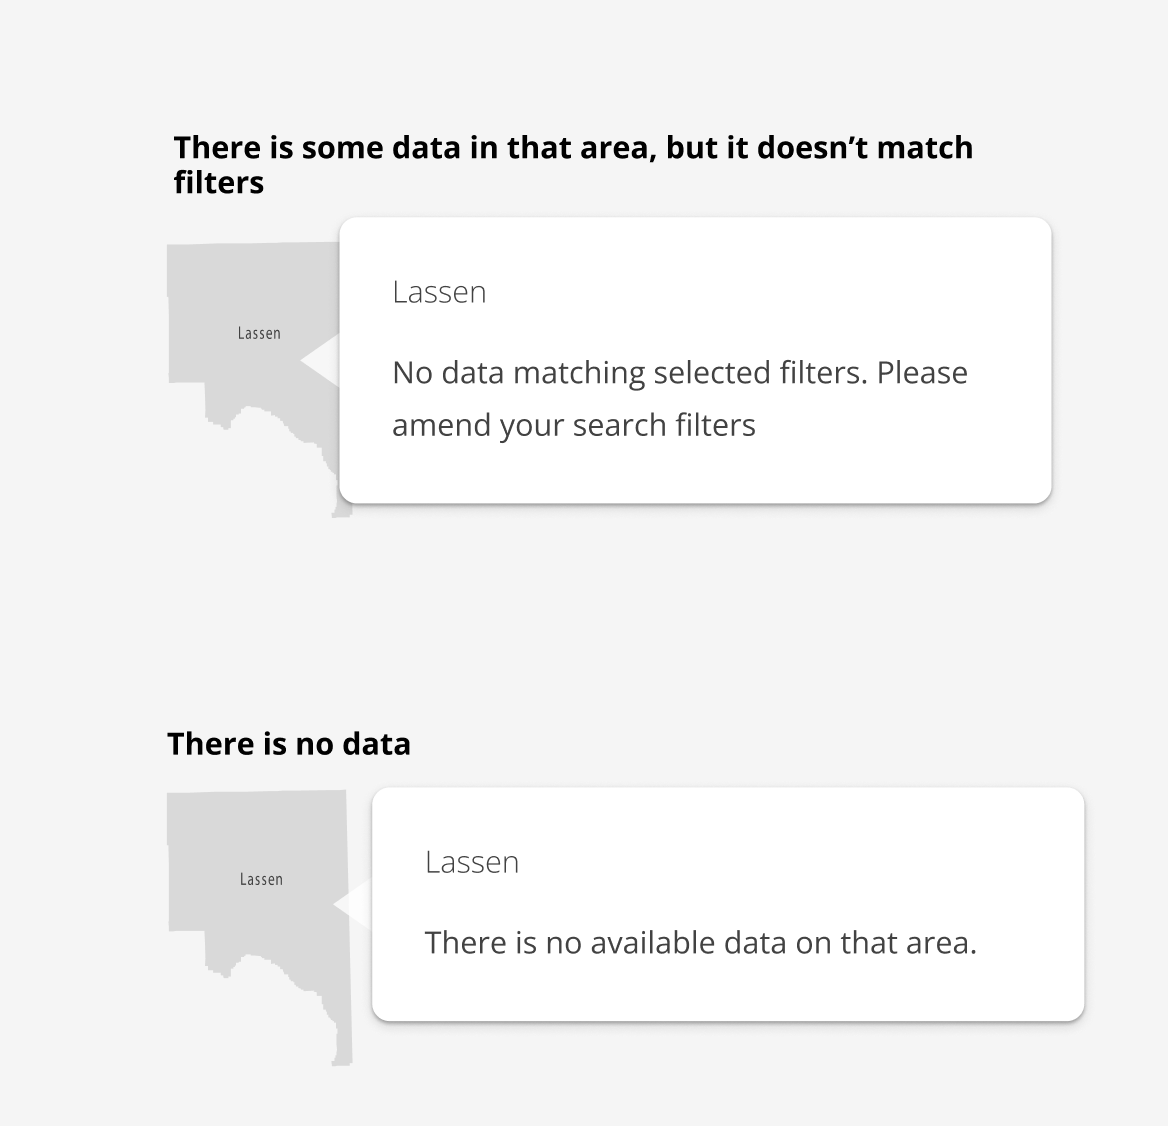
14
The following tooltip is shown when no data matches your filter set or no data is available in a specific area.
15
Return
Return to Your Solutions to review your detailed insights at any time or re-run the solution using a different scenario.
Ready to get started? Click here:
JavaScript errors detected
Please note, these errors can depend on your browser setup.
If this problem persists, please contact our support.